Analysis of financial and economic indicators
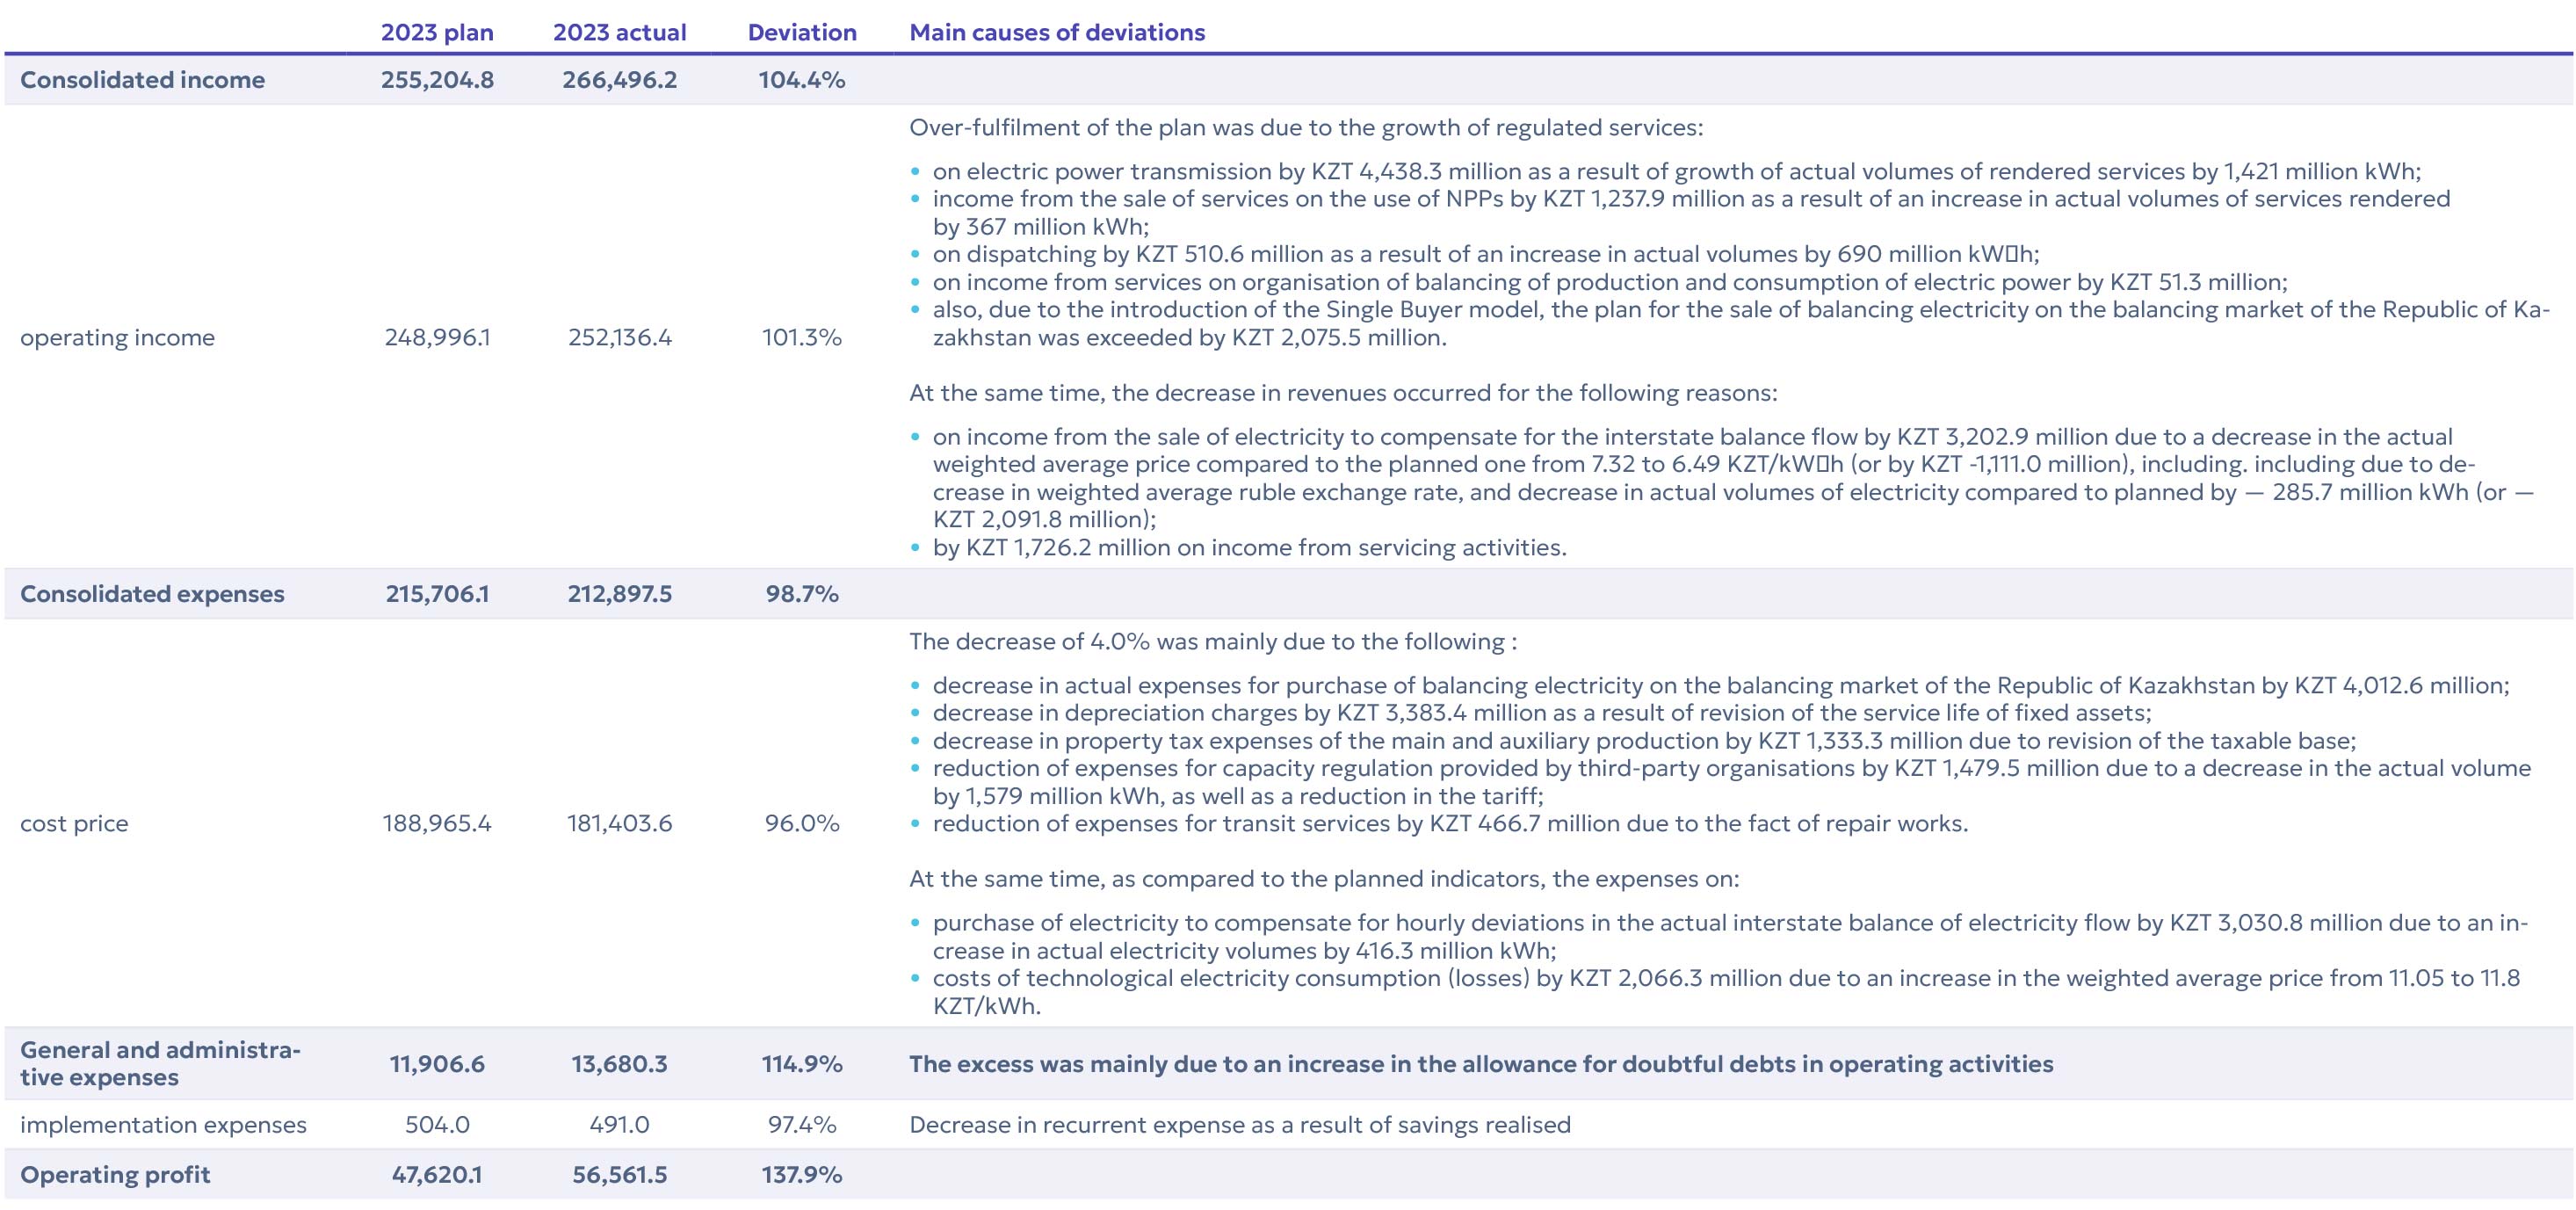
Analysis of actual income and expenses figures for 2023, KZT million
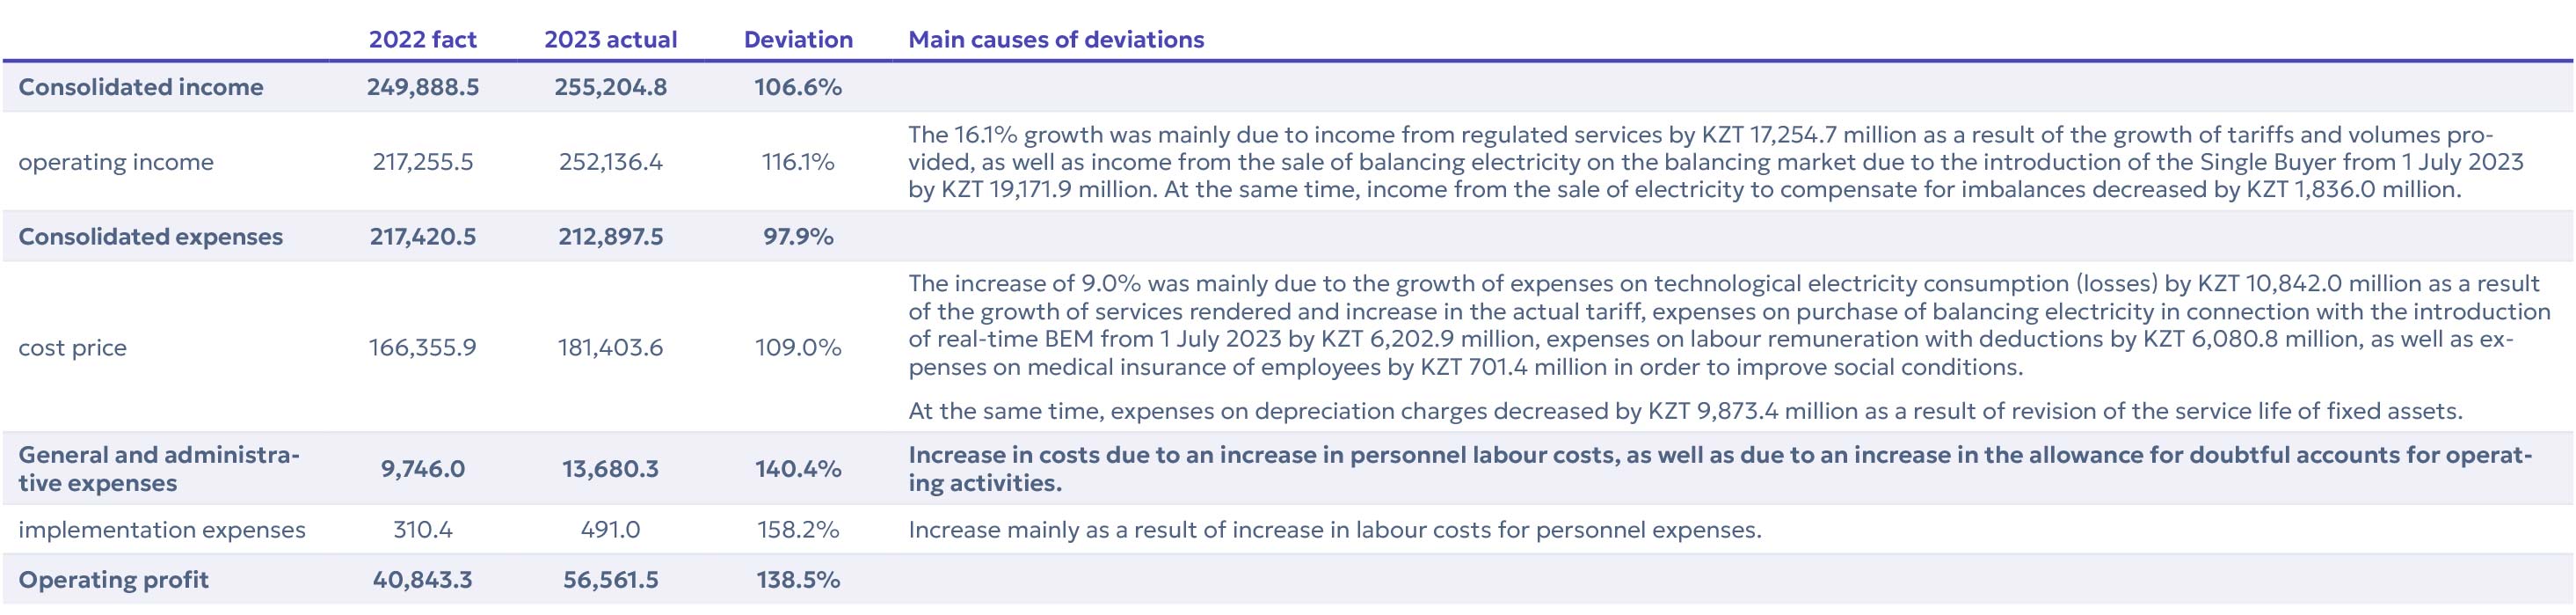
Analysis of actual income and expenditure figures for 2023 with actual figures for 2022, KZT million
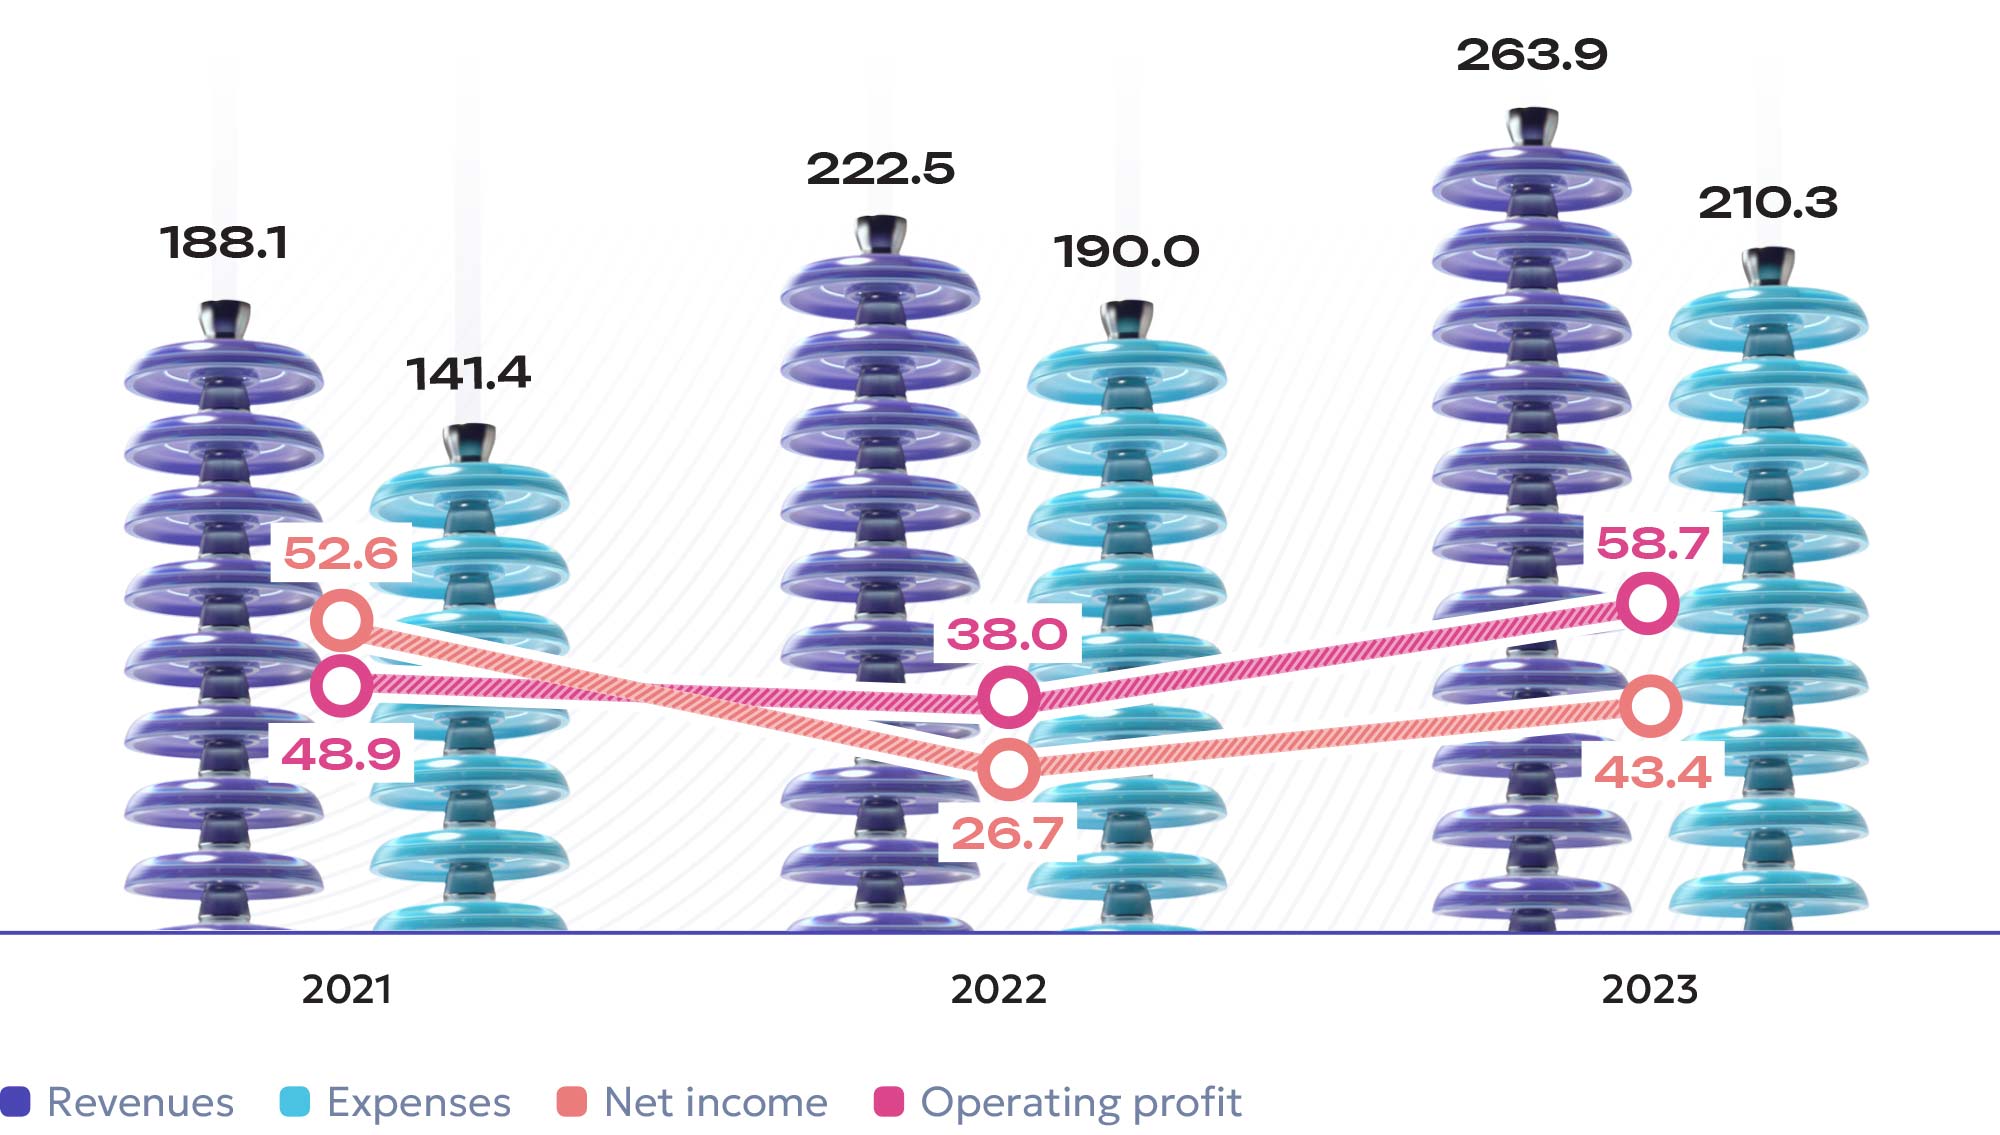
Dynamics of financial and economic indicators, KZT billion
Ratio analysis
In 2023, ROACE increased by 2.327 percentage points from the 2022 level, including: by 2.179 percentage points due to an increase in adjusted profit (NOPAT) of KZT 18.07 billion, and by 0.148 percentage points due to a decrease in average capital employed (ACE) of KZT 29.54 billion.
At the end of 2023 compared to 2022, EBITDA increased by KZT 5.630 billion due to changes in volumes and tariffs for regulated services (+KZT 17.255 billion), a decrease in the loss from the sale and purchase of electricity to compensate for hourly deviations in the actual interstate balance of electricity flows by KZT 8.797 billion as a result of the introduction of a new mechanism of the electricity market. The change in the indicator was also affected by:
- increase in labour costs including deductions by KZT 6.451 billion;
- increase in expenses on technological electricity consumption (losses) in the amount of KZT 10.842 billion as a result of growth in the average purchase price of electricity and other factors.
During 2023 the norms on financial stability indicators and covenants were not violated.
Economic value generated and distributed
The economic component of KEGOC JSC activities is of great strategic importance both for the Company itself and for the state economy, and is aimed at increasing long-term value for KEGOC JSC shareholders and investors.
The procedures for development and approval of the Business Plan and budgets (including the Capital Investment Plan for implementation of investment projects for construction, reconstruction and modernisation of the Company’s facilities) are regulated by the Rules for development, coordination, approval, adjustment, execution and monitoring of the Action Plan (Business Plan) and budgets of KEGOC JSC. The Action Plan (Business Plan) is developed on a consolidated basis, i.e. it includes plans of subsidiaries for a 5-year period on a rolling basis. An annual budget is approved for the implementation of the Action Plan (Business Plan). Implementation of the Business Plan is monitored by the Board of Directors of KEGOC JSC on a quarterly basis.
Distribution of economic value, KZT million
| 2021 | 2022 | 2023 | |
|---|---|---|---|
| Total capitalisation | 908,336.27 | 809,916.87 | 849,254.52 |
| equity capital | 737,136.82 | 653,565.16 | 685,719.13 |
| borrowed capital | 171,199.45 | 156,351.70 | 163,535.39 |
| Funds received from the state | - | - | |
| Economic value created | 199,424.10 | 227,003.95 | 263,910.63 |
| operating income | 186,443.14 | 217,255.55 | 252,136.38 |
| financial income | 5,368.22 | 5,726.12 | 7,576.47 |
| other income | 7,612.74 | 4,022.29 | 4,197.78 |
| Distributed economic value: | 201,789.23 | 217,270.65 | 253,879.87 |
| labour costs | 23,672.49 | 26,755.43 | 33,272.86 |
| expenses on taxes and levies to the state budget | 14,047.26 | 18,026.52 | 21,610.03 |
| payments to capital providers | 53,200.01 | 30,309.24 | 47,075.04 |
| charity and sponsorship* | - | - | |
| other operating expenses | 99,492.06 | 136,625.19 | 148,327.37 |
| other non-operating expenses* | 11,377.43 | 5,554.26 | 3,594.57 |
| Profit after tax for the year from discontinued operations | 13,471.47 | - | |
| Economic value to distribution | 11,106.33 | 9,733.30 | 10,030.77 |
Balance sheet analysis
Indicators of KEGOC JSC economic balance sheet, KZT million
| Indicator | 2019 | 2020 | 2021 | 2022 | 2023 | 2023/2022 |
|---|---|---|---|---|---|---|
| Non-current assets | 659,175.9 | 695,192.5 | 1,019,820.4 | 873,932.8 | 881,414.5 | 101% |
| Current assets | 97,111.0 | 116,820.1 | 73,396.9 | 112,679.4 | 120,370.5 | 107% |
| Total assets | 756,987.7 | 812,012.6 | 1,093,217.3 | 986,612.2 | 1,001,785.0 | 102% |
| Capital | 481,838.0 | 502,556.5 | 737,136.8 | 653,565.2 | 685,719.1 | 105% |
| Non-current liabilities | 230,808.2 | 239,766.9 | 310,396.6 | 273 569,6 | 277,539.5 | 101% |
| Current liabilities | 44,341.5 | 69,689.2 | 45,683.9 | 59,477.4 | 38,526.4 | 65% |
| Total liabilities | 275,149.7 | 309,456.1 | 356,080.5 | 333,047.0 | 316,065.9 | 95% |
| Total equity and liabilities | 756,987.7 | 812,012.6 | 1,093,217.3 | 986,612.2 | 1,001,785.0 | 102% |
As of 31 December 2023, the Company’s assets amounted to KZT 1,001,785.0 million, reflecting a 1.5% increase compared to 2022.
Long-term assets accounted for 88.0% of the balance sheet structure, which are mostly represented by fixed assets. In 2023, long-term assets showed a slight growth of 0.9% or by KZT 7,481.7 million and amounted to KZT 881,414.5 million.
Short-term assets accounted for 12.0% of the balance sheet. In 2023, they increased by 6.8% (or by KZT 7,691.1 million), amounted to KZT 120,370.5 million at the end of the year. The growth was driven by increased trade receivables due to legislative amendments in the energy sector related to the introduction of the Single Power Purchaser model and the launch of the balancing electricity market, as well as an increase in cash and cash equivalents. At the same time, the growth in short-term assets was partially offset by a decrease in current financial assets due to the redemption of KZT 30,000 million of coupon bonds of Samruk-Kazyna JSC.
The capital at the end of 2023 was KZT 685,719.1 million, showing growth by 4.9% or KZT 32,153.9 million compared to 2022. This was due to the secondary placement of ordinary shares within the framework of the SPO of KEGOC JSC and growth of retained earnings. The share of equity in the structure of the balance sheet was 68.4%.
Liabilities totaled KZT 316,065.9 million by year-end, decreasing by 5.1% or KZT 16,981.2 million compared to 2022. Long-term liabilities constituted 87.8%, while short-term liabilities accounted for 12.2% . The change is mainly due to a decrease in liabilities on dividends payable for the 1st half of 2022 by KZT 17,014.3 million, a decrease in liabilities on loans due to partial early repayment of part of the loan of the International Bank for Reconstruction and Development in the amount of USD 10,000.00 thousand, a decrease in deferred tax liability on income tax by KZT 4,328.6 million. At the same time there was an increase in long-term liabilities due to attraction of ‘green’ bonds for the amount of KZT 16,000 million on 30 March 2023.
In order to reduce currency risk, debt burden and expenses on servicing loans in foreign currency, in September 2023 KEGOC JSC made an early full repayment of the International Bank for Reconstruction and Development loan in the amount of USD 1,010.0 million. Funds under the credit line in the amount of USD 48,000 thousand were attracted in 2009 for the implementation of the investment project ‘Scheme of power output of Moynak HPP’ for a period of 25 years. The effect is a decrease in net foreign currency liabilities from USD 26,836 million to USD 14,599 million, as well as a decrease in foreign exchange loss due to changes in foreign currency positions.
Stable its financial performance allows the Company to fulfill in a timely manner and in full its obligations to the main stakeholders:
- on payment of wages to employees and provision of social support;
- on payment of dividends to shareholders;
- on implementation of investment projects and improvement of the quality and reliability of NPG functioning;
- on timely settlements with suppliers;
- on payment of taxes.
Profitability indicators of KEGOC JSC, KZT billion
Indicators for the implementation of Goal 3
| Name of KPI | 2019 actual | 2020 actual | 2021 actual | 2022 actual | 22023 plan* | 2023 actual |
|---|---|---|---|---|---|---|
| TSR (total shareholder return), % | indicator is defined in December 2021 | -10.7 | 7.06 | 3.44 | ||
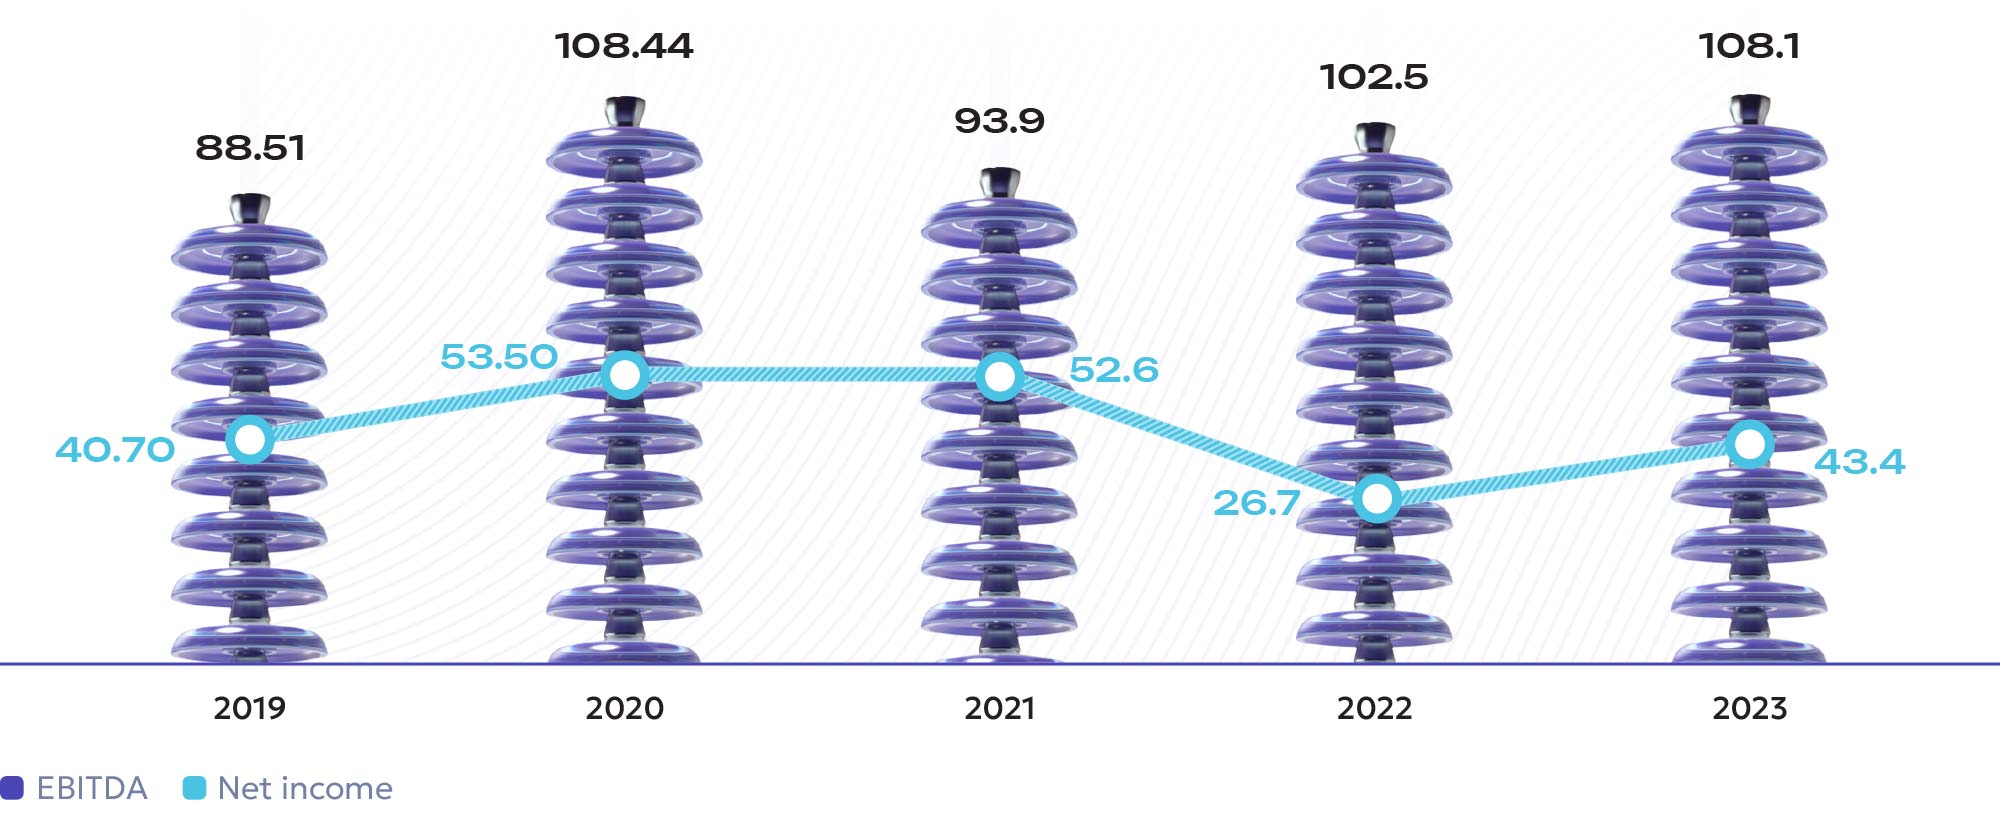
| EBITDA, KZT billion | 88.5 | 108.4 | 93.9 | 102.5 | 102.6 | 108.1 |
* planned values set by the Business Plan for 2023-2027
The actual value of TSR was affected by a decrease in the Company’s share price in 2023 to KZT 1,482 per share against a target of KZT 1,552 per share, with the Company paying KZT 193.76 in dividends per share against a target of KZT 182.23 per share. EBITDA growth was influenced by the factors of transmission volume growth and an increase in tariffs for regulated services.